Tag Archive: data science


🤔 What is it?

Locality Sensitive Hashing (LSH) is an efficient technique used for approximate KNN search, which is a core function of several billion-dollar companies such as Amazon, Google, Netflix, Spotify, and Uber. What makes LSH so popular is its ability to perform efficient and fast similarity search. In simple terms, LSH maps similar data points to the same hash bucket with high probability, allowing for fast similarity search while maintaining a reasonable level of accuracy.

🕵️‍♂️ How does it work?

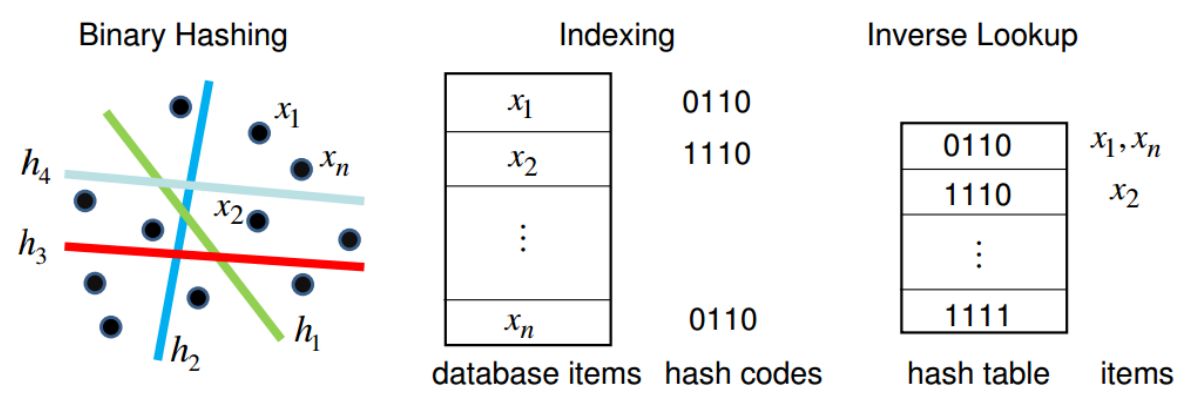
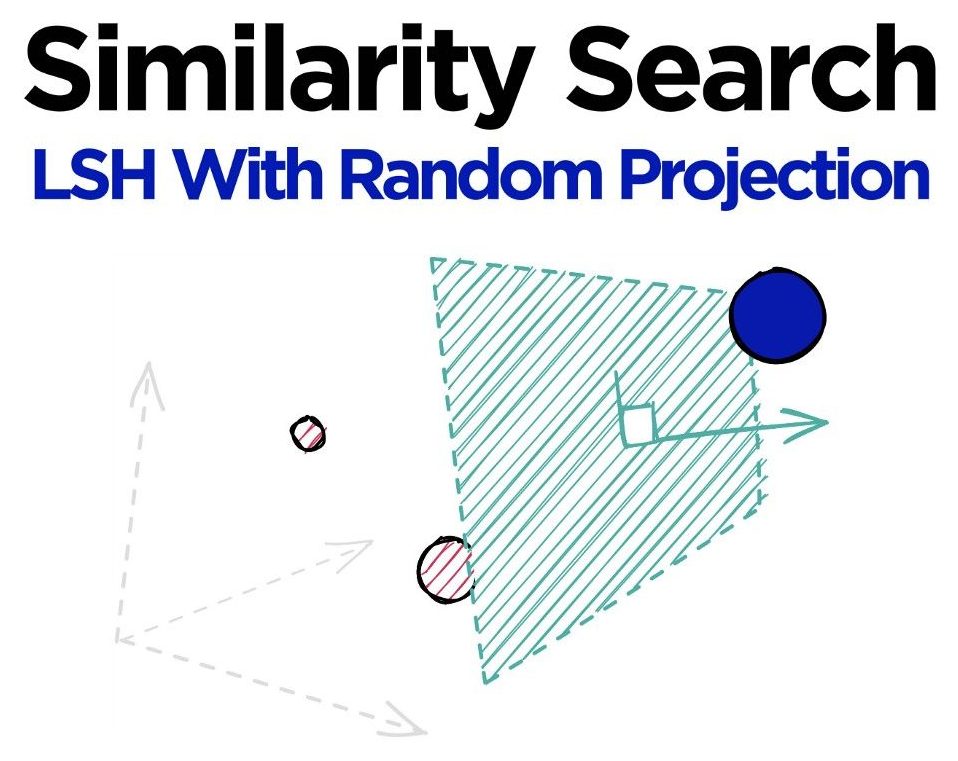
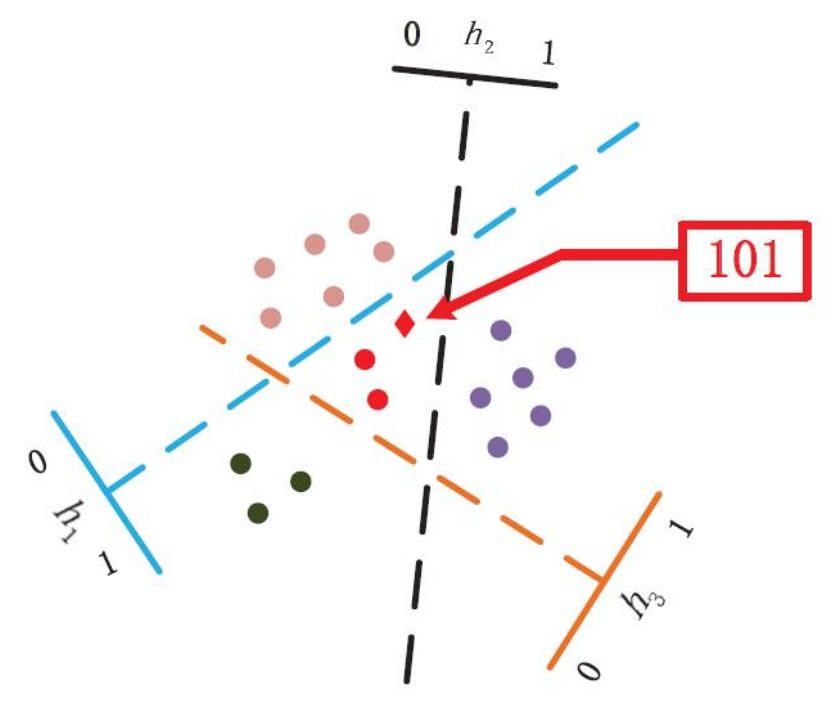
The LSH algorithm leverages a family of hash functions and random hyperplanes to partition the feature space into regions, allowing similar data points to be grouped together in the same hash bucket. Each hash bucket represents a region in the feature space. Once the hash buckets are constructed, we can perform the approximate KNN search by identifying candidate neighbors based on their hash values. The accuracy and efficiency of LSH depend on the quality of hash functions and the number of hash buckets used. Increasing the number of buckets improves accuracy but also increases computational cost.

👨‍💻 My personal story

As a Machine Learning Engineer, I can say that working with large datasets and high-dimensional feature spaces can be a challenging task. That’s where techniques like LSH come into play, allowing us to perform efficient similarity search and reduce the computational cost of the search process. LSH has been an essential tool for me when working on NLP problems, especially when dealing with large document datasets. It has allowed me to perform document retrieval tasks and save computational resources.

📚 Who should learn it?

LSH is a widely used algorithm that enables efficient similarity search on large datasets, making it an essential tool for machine learning professionals. Learning LSH can provide practical skills and deeper understanding of fundamental concepts for those interested in building efficient and scalable information retrieval systems. In general, LSH can be applied to various applications, including recommendation systems, content-based image retrieval, and document retrieval.

🗣️ Let’s talk!

Have you used LSH in any of your machine learning projects? What were your experiences with it? I am here to help if you have any questions or would like to know more.
Machine learning friends! 💡

William of Ockham, a 14th-century friar and philosopher, had a deep appreciation for simplicity. His famous principle, Ockham’s Razor, suggests that when several explanations are possible, we should prefer the simpler one.

In machine learning terms, the idea is remarkably relevant: the less complex an ML model is, the more likely it is that a good empirical result reflects something real rather than simply the peculiarities of the sample.

This is one reason why model complexity matters. A highly sophisticated model may fit the training data extremely well, but that does not necessarily mean it will generalize to new, unseen data. Sometimes, the simplest model that explains the evidence is also the most useful.

And we should never forget that philosophy often speaks first about the interesting, new, and seemingly crazy ideas that later influence science and technology.

The real art in science, machine learning, and software engineering is not necessarily to build the most complicated solution. It is to find solutions that are simple, explainable, robust, and elegant.

Sometimes, less really is more.

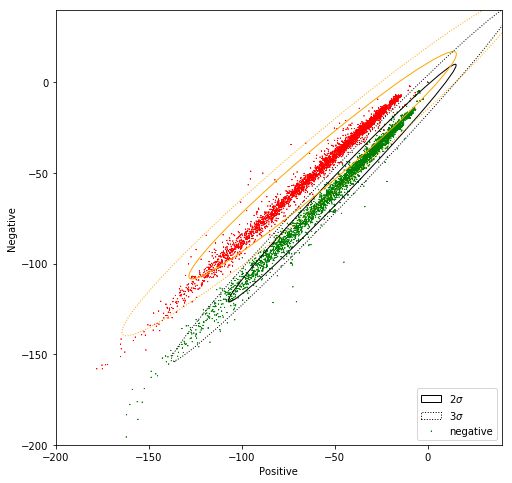
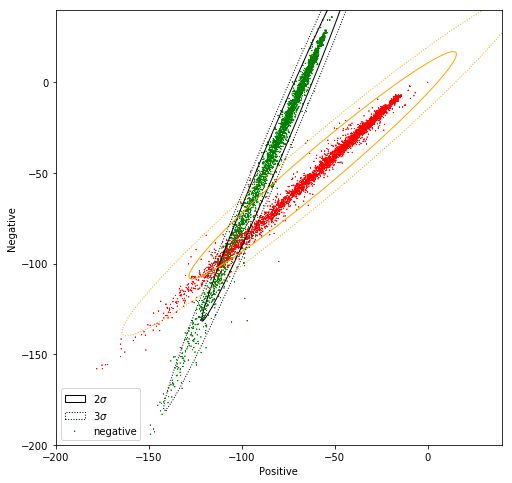
Sometimes we want to visualize multiple data distributions in a 2D scatter plot. However, the points of different distributions can overlap a lot or even hide each other. To visualize the distributions more clearly and get a better understanding of our data, we can use confidence ellipses.

Confidence ellipses summarize the main information of a dataset using only four parameters: center, width, height, and angle. The center of the ellipse can be calculated using the mean of the data. The width and height can be determined based on the number of standard deviations from the mean, while the angle can be computed using the covariance matrix of the data.

Technically, to implement a confidence ellipse, we can first create a simple ellipse and then transform it using 2D affine transformations, such as scaling, rotation, and translation.

In the images below, we can see two distributions from a sentiment analysis project: positive and negative sentences. We can plot a confidence ellipse around each distribution to make the overall structure easier to understand.

In this example, the distributions are relatively easy to grasp even without the ellipses, but this is not always the case. When distributions overlap heavily or contain many data points, confidence ellipses can provide a simple and effective way to visualize their shape, spread, and orientation.

Hello my AI friends!

Today, I would like to share with you skrobot!

skrobot is an open-source Python module I have created at Medoid AI for automating Machine Learning (ML) tasks. It is built on top of scikit-learn framework and follows object-oriented design (OOD) for ML task creation, execution, and reproducibility. Multiple ML tasks can be combined together to implement an experiment. It also provides seamless tracking and logging of experiments (e.g. saving experiments’ parameters).

It can help Data Scientists and Machine Learning Engineers:

  • to keep track of modelling experiments / tasks
  • to automate the repetitive (and boring) stuff when designing ML modelling pipelines
  • to spend more time on the things that truly matter when solving a problem

The current release of skrobot (1.0.13) supports the following ML tasks for binary classification problems:

  • Automated feature engineering / synthesis
  • Feature selection
  • Model selection (i.e. hyperparameters search)
  • Model evaluation
  • Model training
  • Model prediction

For more information you can check out the online documentation!

Lastly, many thanks to all contributors who helped to extend and support skrobot.

Stay safe!

Hello my friends!

Today, I would like to share with you Time Series Segmentation & Changepoint Detection!

It is an open-source R/Shiny app for time-series segmentation and changepoint detection tasks. The app acts as a front-end for R packages such as the magnificent changepoint package.

I had the pleasure of working together with wonderful colleagues at Medoid AI to develop this application. My role in this small project was more organizational and consulting.

For more information on the parameters and algorithms currently included in the app please read the following paper by Killick et al. For an overview of changepoint packages that may be included in the future please see the following page.

Stay safe!

Hi people!

I have created -just for fun- a Node.js web application that provides you a random data science image!

Demo Application:

https://random-data-science-image.onrender.com

Source Code Repository:

http://github.com/efstathios-chatzikyriakidis/random-data-science-image

Images Database Repository:

http://github.com/efstathios-chatzikyriakidis/data-science-images

Happy Hacking!